

Consumer resilience persists, but pressures are building

By Brian LeBlanc
Head of Economic Analysis, PNC Economics Research
Are higher prices finally catching up with consumers?
Consumer spending has remained remarkably resilient in 2026. Despite rapid increases in gasoline prices, ongoing affordability concerns, above-trend inflation, and higher interest rates, spending actually accelerated through the first half of the year. As we’ve written about previously, this resilience likely reflects two main factors. First, household balance sheets were very healthy entering the year, providing room to absorb these shocks. Second, larger tax refunds in the spring helped shelter consumers from the impact of higher prices.
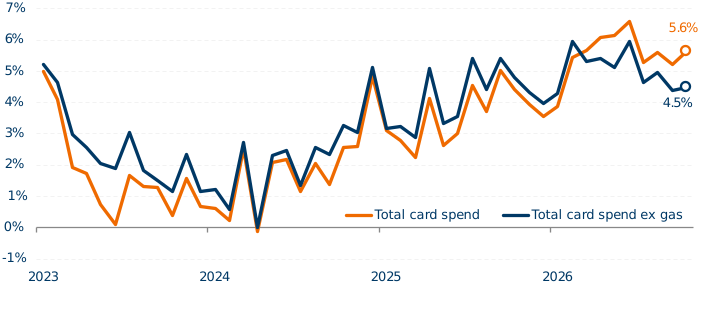
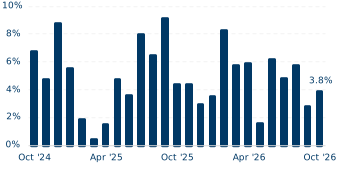
Spending remained solid on a seasonally adjusted year-over-year (YoY) basis in October, with total card spending increasing 5.6% YoY and 4.5% excluding gasoline. However, momentum has been weaker in recent months. Card spending outside of gasoline has increased at only a 3.8% annualized pace over the past three months, barely enough to keep pace with inflation.
Figure 1: YoY percentage change in combined debit and credit card spending, seasonally adjusted
Source: PNC internal data
Note: Seasonally adjusted by PNC. Growth is the year-over-year percentage change in monthly seasonally adjusted spending.
Figure 2: Card spending excluding gas: 3-month annualized growth
Source: PNC internal data
Note: Combined debit and credit card spending, seasonally adjusted
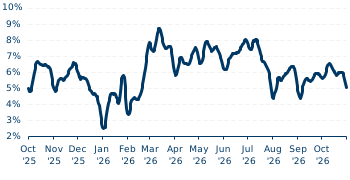
Figure 3: YoY growth rate of daily card spending on discretionary items
Source: PNC internal data
Note: 28D moving average
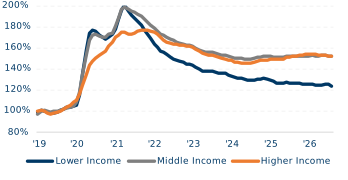
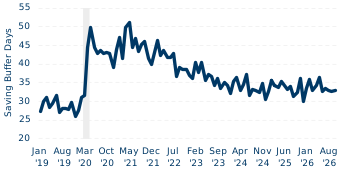
So, is the impact of higher prices finally catching up with consumers? We think the evidence is mixed. For one, household balance sheets remain very healthy by historical standards. Average checking and savings balances remain elevated even after accounting for inflation, median savings buffers remain stable, and the percentage of households living “paycheck-to-paycheck” has not increased in 2026.
Figure 4: Median inflation-adjusted checking and savings deposit balances as a % of ‘19 levels (3M MA)
Source: PNC internal data
Note: Chart shows data seasonally adjusted by PNC and deflated using PCE price index, 3-month moving average (3M MA)
Figure 5: Median days of household savings buffers
Source: PNC internal data
Note: Chart shows the number of days households can maintain current spending using existing cash balances if no new income comes in.
On the other hand, there is evidence that households are relying more heavily on credit cards to sustain spending. To be clear, credit card balances per active account remain low, but they have increased by more than 9% over the past year, the fastest pace since before the pandemic. Additionally, the fraction of balances being paid off each month has steadily declined through 2026.